Getting started
If you have just unpacked the LI-720, gather the sensor and the USB data/power cable (part number 99512-062) and prepare to connect to a Windows PC.
First things first
Always store and ship the LI-720 in the shipping box with foam. This protects the optics from impacts that may alter the calibration. See Shipping the LI-720.
Caution: Do not drop the LI-720 or expose the spheres to impacts, and do not handle the instrument when it is powered on. Drops and impacts will affect the calibration. If the LI-720 is subject to a drop or impact, STOP. Check the RSSI (see Checking and adjusting the signal strength). If the RSSI is not close to 100, clean the optics. If the RSSI does not approach 100 after cleaning the optics, check the zero (see Calibrations). If the zero has shifted, perform a zero and span calibration.
Connect the LI-720 to a PC
Although you don't need to connect the LI-720 to a computer most of the time, follow these steps for the initial performance check and for calibration adjustments.
-
Download the CarbonWare application and install it on your computer (Windows® OS).
Download CarbonWare here.
-
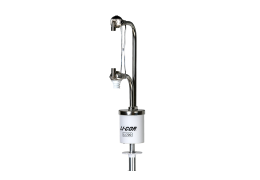
Unpack the LI-720 and gently place it on a desk or lab bench.
-
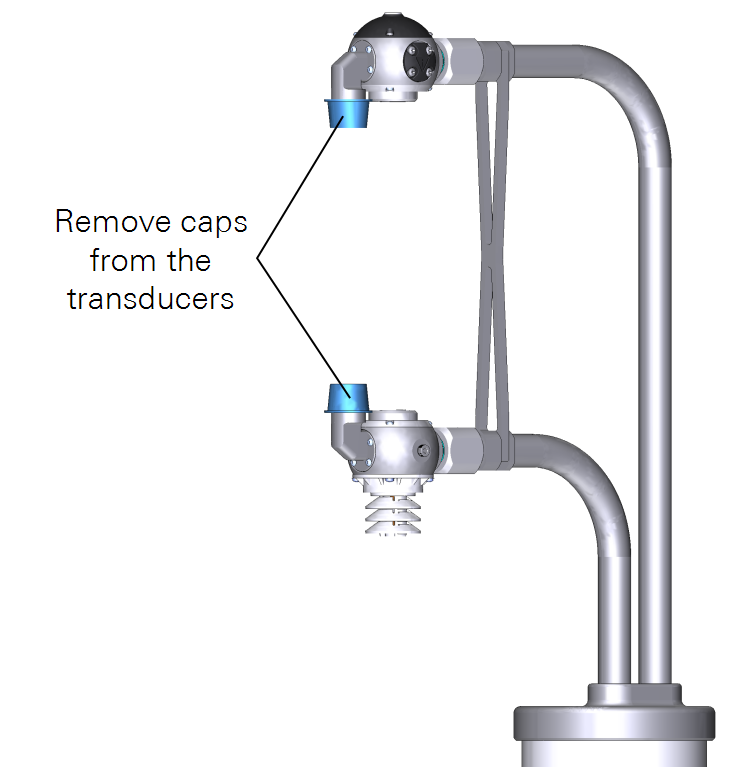
Remove the caps from the sonic transducers.
-
Install the USB data/power cable (part number 99512-062) between the sensor and your computer.
Do not use a USB extension or device extension cable when powering the LI-720 from a 5 V USB power supply. Extension cables may result in voltage drops that affect both power and digital communication. Do not deploy the LI-720 while powered from 5 V USB power. The LI-720 requires 9 to 33 VDC for field operation.

-
Launch the CarbonWare application.
The LI-720 is presented as a COM port; most likely, it is the only item in the list, or one of a few items. If you can't tell which port hosts the LI-720, search the computer device manager to identify port numbers.
-
Select the COM port and click Connect.
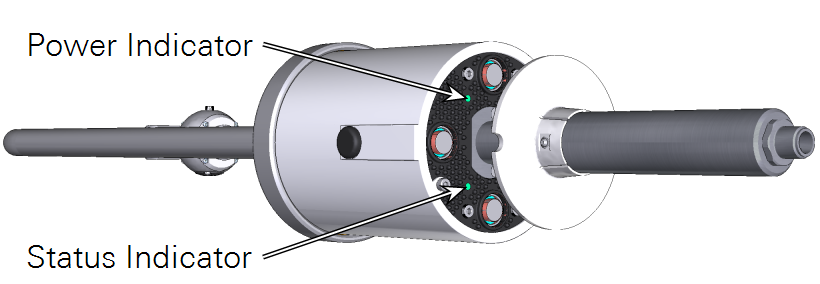
The Power LED will stay on and measured data will stream into the CarbonWare interface. The Status LED is off during normal operation.
Initial performance check
To verify the performance of the LI-720, you can observe some measurements and responses in the CarbonWare application. Many of these parameters are displayed by default the first variables tab. Select the third variables tab and add other variables to it to see the readings.
-
Check readings for CO2, H2O, TA, RH, and PA. Readings should be plausible. Exhale through the optical path and observe the CO2 and H2O readings. Both measurements will spike briefly when exhaled air passes through the path. If the CO2 and H2O readings seem implausible, check the zero and span.
-
Observe the PPFD reading. In an office or lab, expect a reading between 2 and 100, depending on how close the sensor is to the light. Shade the quantum sensor with your hand. The reading will approach zero when covered.
-
Check the RSSI, T_det, T_src, and RH_src (see Adding variables to the display list). If the RSSI is less than 95, clean the optics with a soft, lint-free cloth. T_det and T_src should be 1 – 2 degrees above ambient; RH_src should be near zero.
Now, you're ready for the next steps:
-
Working with the CarbonWare application (see A tour of CarbonWare).
-
Configure the LI-720 as a Carbon Node on LI-COR Cloud (see Configuring the Carbon Node).
-
Configure the LI-720 for data loggers (see Logging LI-720 Data to a Campbell Scientific Datalogger).
A tour of CarbonWare
An application for Windows OS computers, CarbonWare is used to adjust the user-calibrations, apply firmware updates, enter site information relevant to flux calculations (if not using LI-COR Cloud), and other tasks.
Download CarbonWare here.
![]()
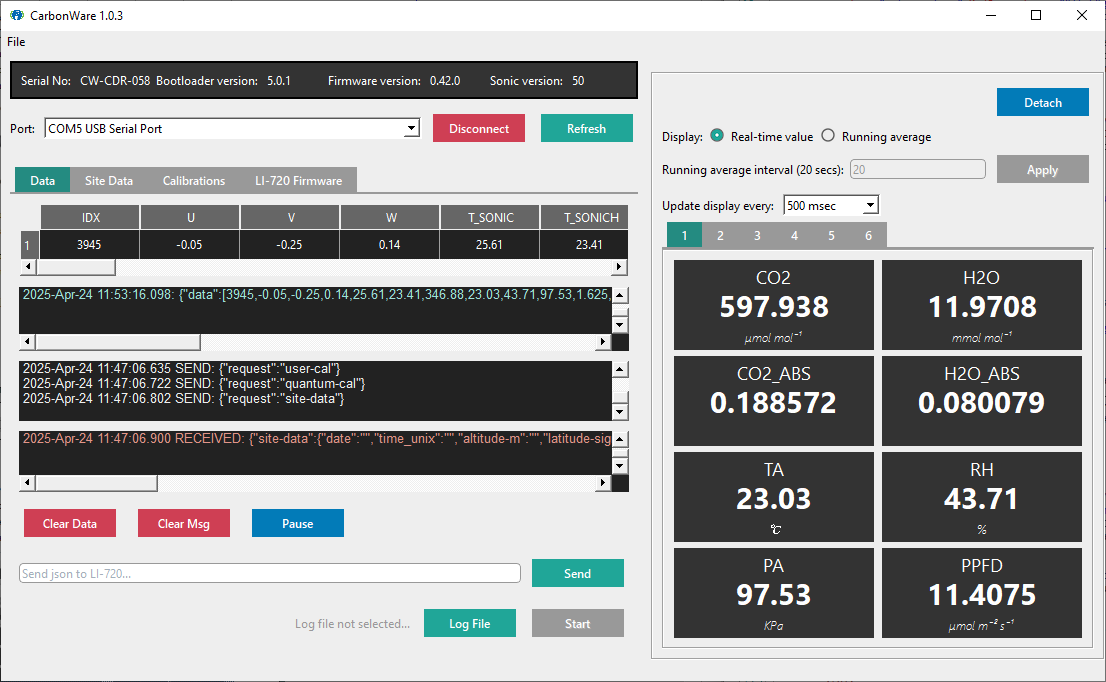
Home window
After connecting, you'll see data stream into the interface, along with status information and measured data. The interface reports firmware information for the connected LI-720, tabs (Data, Site Data, Calibrations, and LI-720 Firmware), data display settings, and data.
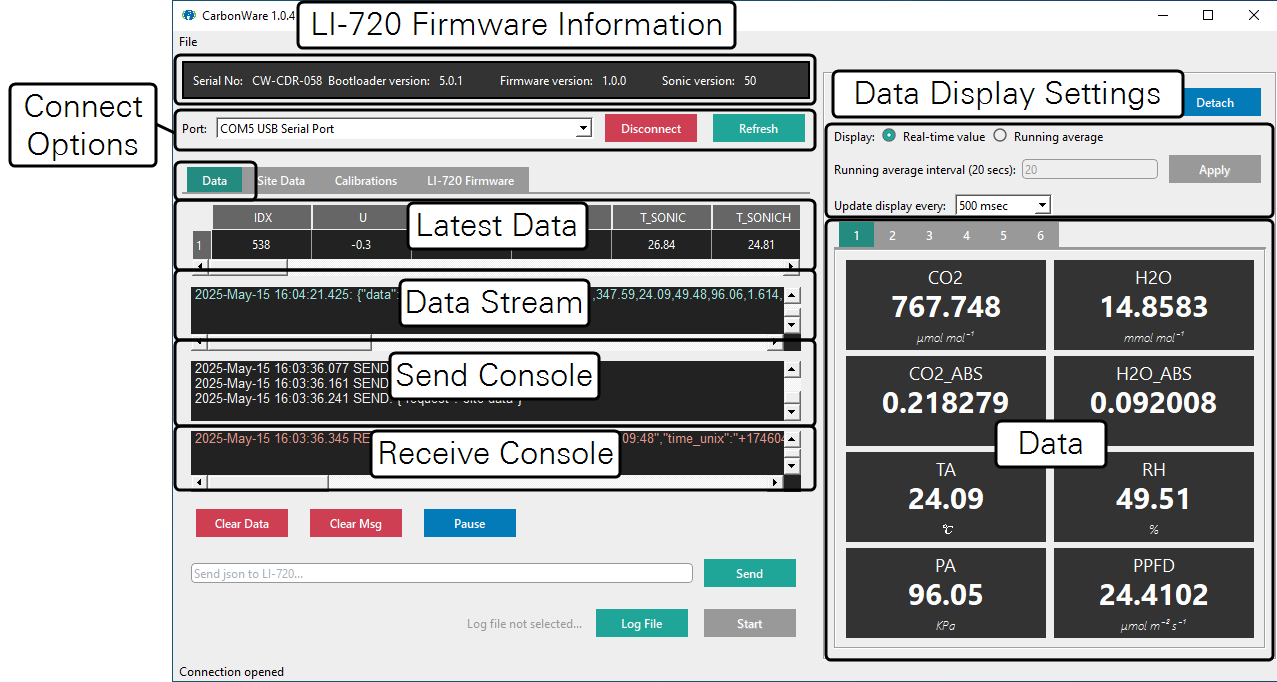
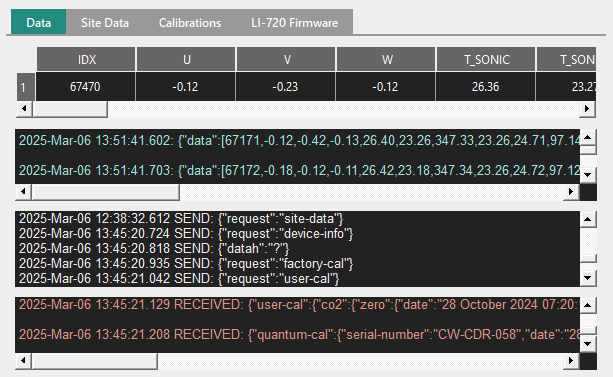
Data tab
The Data tab presents four frames with text, data, or other information.
-
Latest Data: A table of the most recent 10 Hz
.jsondata. Scroll to the right to see the full table. -
Data Stream: Up to 600 lines of the latest 10 Hz data received from the instrument.
-
Send Console: Up to 100 lines of the most recent messages sent from the application to the LI-720, and any app errors parsing serial data from the LI-720.
-
Receive Console: Up to 100 lines of the most recent messages received by the application from the LI-720 that are not 10 Hz data. This includes any error messages output by the LI-720 and all LI-720 responses to setting calibrations.
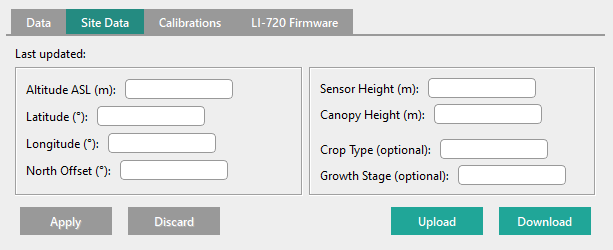
Site Data tab
Site Data will be used to compute flux results and must be entered for accurate calculations. Site data is stored in the LI-720. Parameters include:
-
Altitude ASL (m): Altitude above sea level in meters. If blank, the LI-720 uses GPS altitude.
-
Latitude (°): Decimal degrees. Enter a positive number for north or a negative number for south. If blank, the LI-720 uses GPS latitude.
-
Longitude (°): Decimal degrees. Enter a positive number for east or a negative number for west. If blank, the LI-720 uses GPS latitude.
-
North Offset (°): Degrees of rotation clockwise past magnetic north. The LI-720 features a built-in magnetometer and it will compute the North Offset automatically (not corrected for declination). However, in environments where magnetic material may affect the measurement, a user-entered value should be used instead.
-
Sensor Height (m) or Measurement Height (m): Distance between the center of the sample path and the soil surface in meters.
-
Canopy Height (m): Distance between the top of the plant canopy and the soil surface in meters.
-
Crop Type (optional): Free entry for record keeping and analysis, the crop type can assist with interpreting the data.
-
Growth Stage (optional): Free entry for record keeping and analysis, the growth stage can assist with interpreting the data.
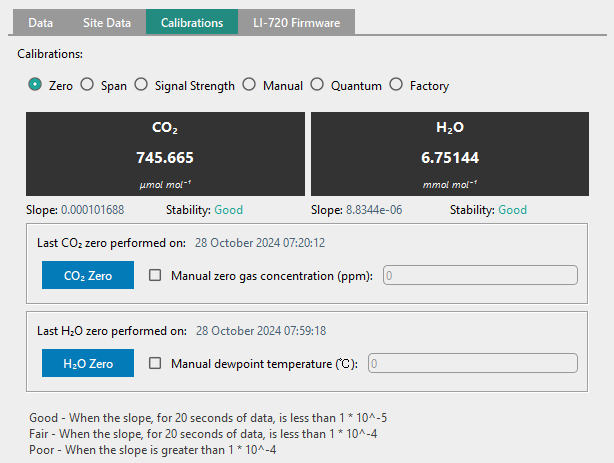
Calibrations tab
Each component may need to have calibrations adjusted. The Calibrations tab presents the controls, beginning with CO2 and H2O zero settings. Other options include CO2 and H2O spans, signal strength scale adjustments, quantum sensor calibration, and options to upload or download a calibration file. Full user-calibration instructions are in Calibrations.
Firmware tab
The Firmware tab allows you to manually apply a firmware update to the LI-720. Full instructions are in LI-720 firmware.
Data display settings
You can change the data display settings to reduce the update rate or apply block averaging. This is a display setting that does not affect logging or computations.
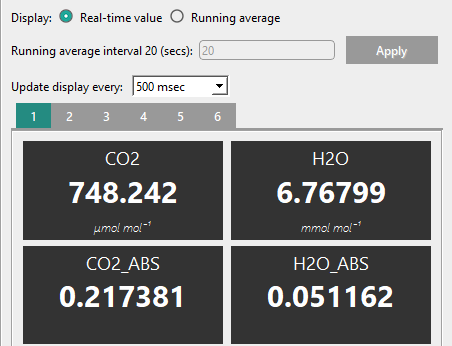
Display options
Numerical data are displayed in eight tabs. You can change the display options:
-
Select Real-time value to allow the interface to update 10 times per second.
-
Select Running average to display an average of a time period once per second. You can also set the time period by entering a Running average interval.
-
Update display every: Select 100 ms to update at 10 Hz. Or, select a longer time period for a less frenetic update frequency.
-
Detach: To view the measurements in a different part of your computer display, click Detach to make a new window or Reattach to combine the windows.
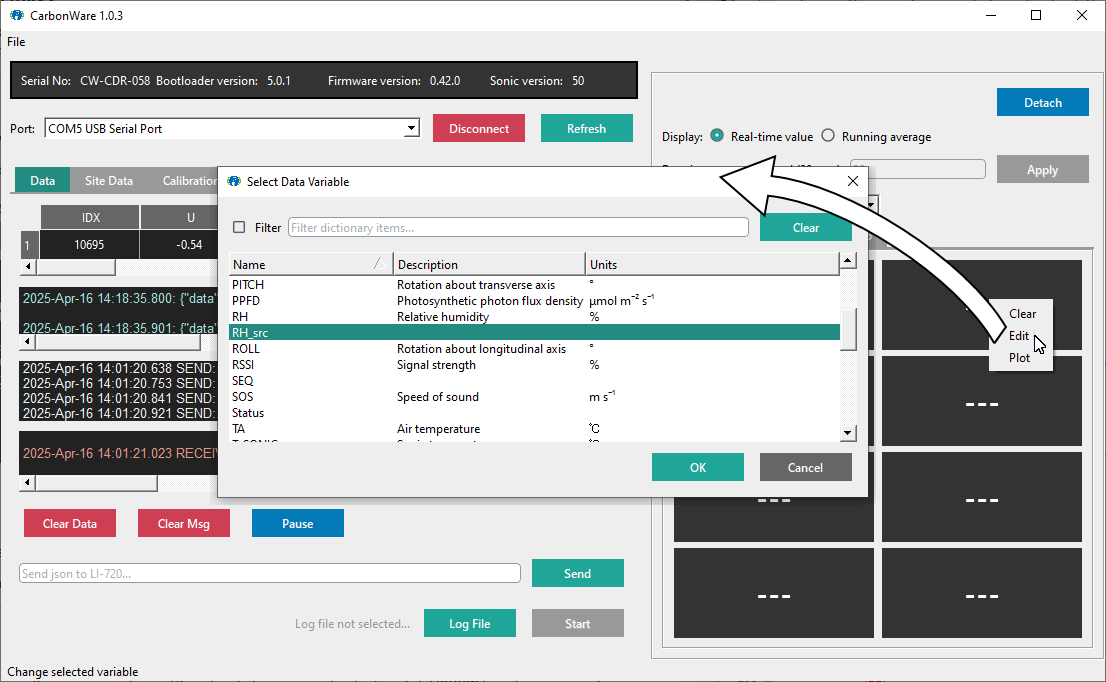
Adding variables to the display list
Tabs 1 and 2 are configured to show some common variables. You can customize them and add variables to the other tabs. To customize the variable list:
-
Right-click in a tile to open the menu and click Edit.
-
Select a variable from the table.
-
Click OK to add it to the table.
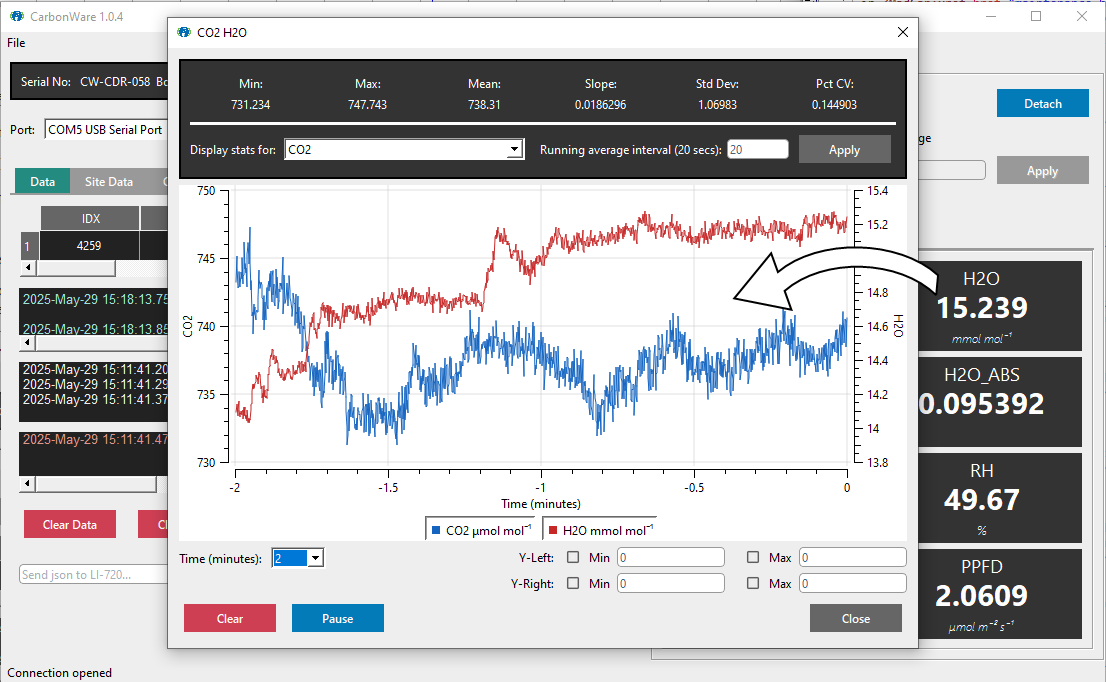
Viewing a quick plot
-
Double click a variable to open plot of the variable.
...or...
-
Right-click a variable and click Plot.
Click and drag more variables from the table into the plot to view multiple variables in one plot. You can add as many variables as you want and you can change the time period and left and right axis scales.