


The Log Setup tab is where you create new data files, set criteria related to logging, and configure the log options.
Stability
Stability criteria are used mostly for efficient logging. Rather then having a fixed (and guessed) time to wait before capturing data, an Autoprogram or Background program can look to the stability criteria you have set to make that decision for you (within a window of minimum and maximum wait times). While stability criteria have no use in soil respiration, limited use with the aquatic chamber, and are ignored while logging during dynamic assimilation technique (DAT) data collection, they are invaluable for steady state leaf applications.
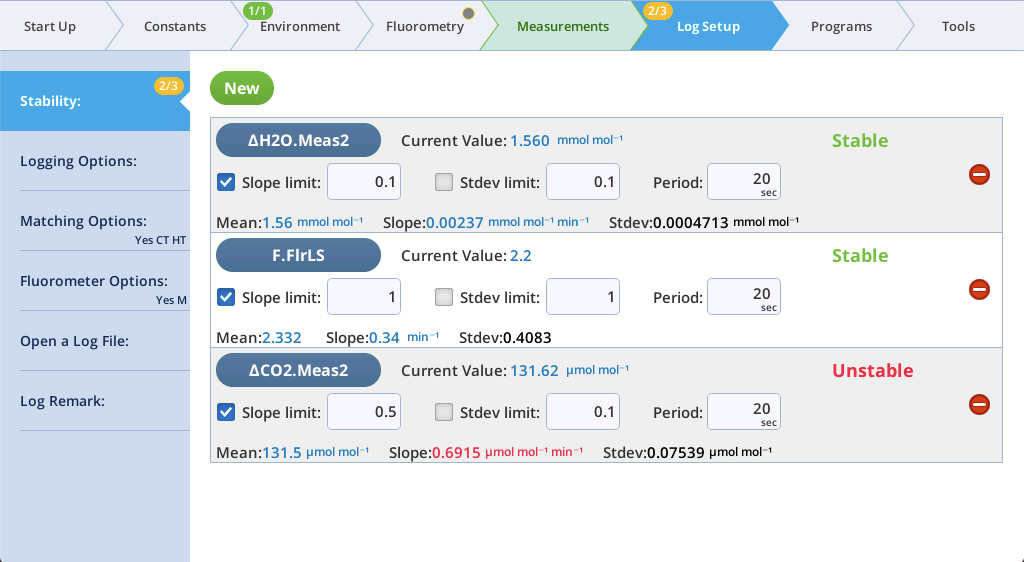
You can set up stability criteria based on measured or computed variables under the Stability tab (Figure 3‑26).
General comments and guidelines
-
Which variables to target? Typically, you would target a set of variables that encompass the following: assimilation, conductance, and (if measured) fluorescence. The factory default targets the sample-reference differential concentrations (deltas) for CO2 and H2O, which are foundational to subsequent gas exchange computations. Targeting the delta is much preferable to targeting sample or reference, especially if the individual concentration is actively being controlled (don’t target controlled variables!). Deltas tell you a lot about the instrument’s stability, but may not tell you about the physiological stability of your sample, unless a sample cell is being controlled allowing the system to respond to physiological (e.g. stomatal) changes. A more direct approach is to simply target assimilation and stomatal conductance. The advantage is that you are determining stability on the very items you are probably most wanting to be stable, and including the potential effects of the rest of their mathematical inputs (temperature, pressure, etc.). A potential disadvantage is that assimilation and stomatal conductance are not computed for all configurations, whereas the CO2 and H2O deltas are always available.
-
Slope or Standard Deviation? Or Both? If you have to ask, then use slope and ignore standard deviation. If you have found a good reason to include standard deviation in your stability definition, then of course use it. But standard deviation is really there for ”completeness” sake, and is not particularly useful, for two reasons: 1) Standard deviation, as you approach steady state, is mostly driven by sensor noise, not system or physiological stability. 2) Picking a proper threshold is not intuitive and usually involves a lot of trial and error. On the other hand, a theoretical use for standard deviation in stability is to protect against the random assessment of stability because the slope happens to go through zero even though it may be changing wildly and nowhere near stable. However, for logging purposes, the stability is only checked after a user-set minimum wait time following some system change, which helps prevent this occurrence.
-
How to I determine what slope threshold to use? Experiment. Monitor the slope of the variable in question (tap the expand/collapse arrow on the stability test to view real time display of its slope) as your sample equilibrates, under various conditions of interest. The slope value never just goes to zero. Ideally, it will trend to toward zero, eventually oscillating between ±x, in which case the slope threshold should be some value slightly higher than x. If the slope seems more chaotic than that, then perhaps try a longer averaging period. If slope never really settles down, then either your sample isn’t equilibrating, or else you’ve made a poor choice for the target variable.
-
How do I save and reload the stability settings? The active stability configuration should be remembered through a power cycle. To be safe, however, you should save it. There are two methods of doing that:
-
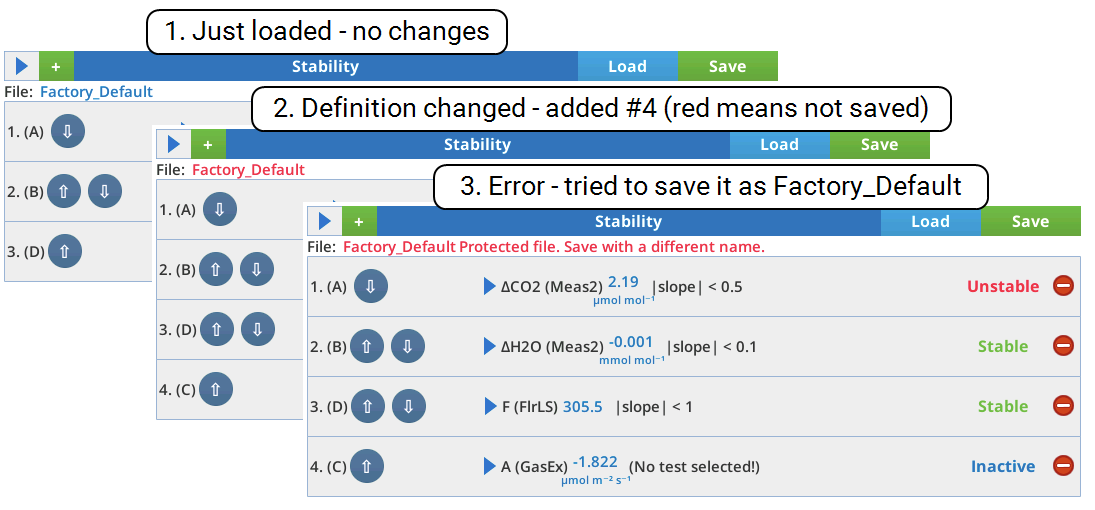
(New in v2.2) Use the Load and Save buttons on the stability screen to load and save stability definitions to disk. The location is
/home/licor/stability/. -
The current stability definition - saved or not - can also be captured as part of a user configuration file, done from Start Up > Configuration > Save Configs and the neighboring Load Configs tab.
-
For many applications, the default stability settings will be quite suitable, especially if you have adjusted the slope threshold settings for your particular situation.
Details of the new features and examples of what you can do with them follow. Most are not necessary for basic functioning, so feel free to skip these sections until you decide to try them out for yourself.
New in version 2.2
Version 2.2 adds some options to stability testing.
-
Formerly, each stability test item was based on evaluating slope and/or standard deviation of a target variable. That is still available, and is called a Standard test. We’ve added a Custom test, which is user definable, and can do anything the standard test can, and more. You can easily switch between the two types of test for a stability item; note the Standard and Custom radio buttons visible in item 3 in Figure 3‑26.
-
Conditional entries (IF, ELSE, END) are available (described below in “Conditionals” on page 5), and allow the stability definition to adapt in real time to changing conditions or configurations, based on the same sort of user definable test found in Custom tests. When these conditionals are present, the order of items in the stability list is important, so the interface now features up/down buttons to shift elements around.
Conditionals do not count as stability tests - they only determine which stability tests are counted.
-
In the past, the target variables for stability were selected from a subset of the full Data Dictionary, limited to items for which keeping statistics made sense. Now, to support the things you might want to test for in the conditionals, the full Data Dictionary is available, as well as the Status Dictionary, which is a collection of behind the scenes variables, handy for determining things like whether the CO2 controller is on target.
Picking target variables
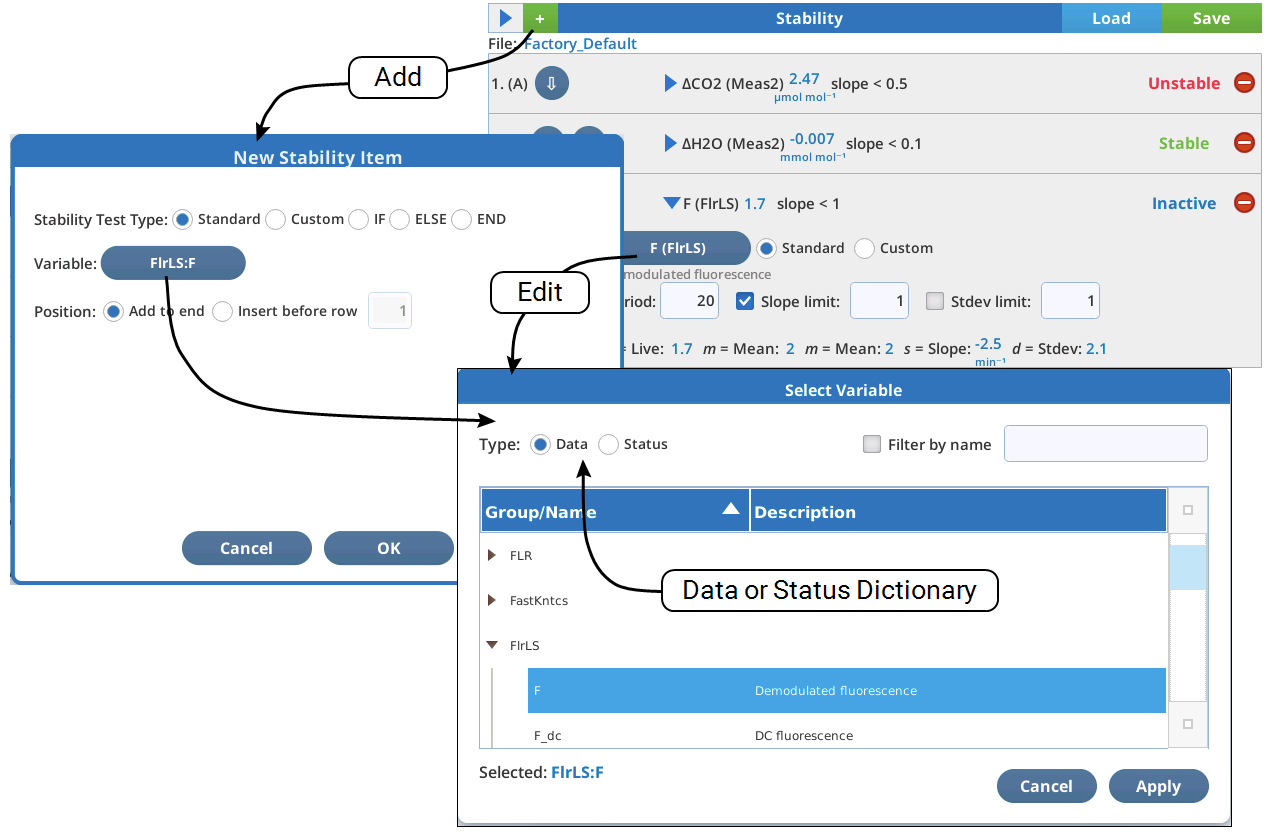
Target variables can be chosen when an item is added, and also when an item is edited (Figure 3‑27).
Standard and custom tests
You can change between a Standard test and a Custom test by tapping the radio buttons:
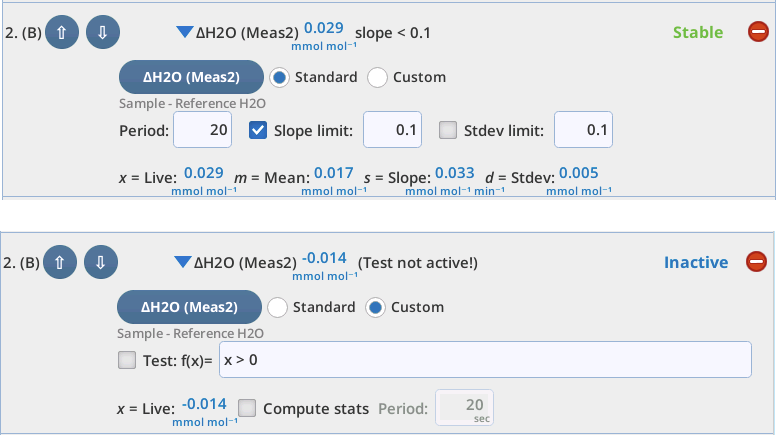
The tests for Custom and Standard are independent, although they share the target variable. Only one or the other is active. To illustrate a Custom test, let’s replicate the original Standard definition (|slope| < 0.1) for this test:
-
Check the Compute stats box.
-
Set the Test definition to abs(s) < 0.1.
-
Check the Test box to activate the custom stability test.
The item now looks like this:
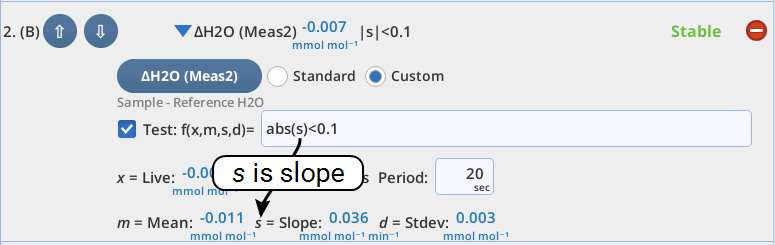
Things to know about the Test expression for a Custom test:
-
It should be a Python expression that will evaluate to a Boolean (True or False). In the above example, we are checking if the absolute value of the slope is less than 0.1.
-
Use the variable x to represent the current value of the targeted variable.
-
If computing statistics, you also have available m, s, and d for mean, slope, and standard deviation of the targeted variable.
-
Test expressions can also refer to other tests or conditionals, by using the item's variable name (A,B,C,… etc.) A.x for example, would refer to the current value (x) the targeted variable in A. A.s accesses the slope value, A.d the standard deviation, etc.
Conditionals
Suppose you only want some stability tests to apply in certain conditions. For example, when doing dark adapted fluorometry, you might only care about fluorescence stability and not the gas concentration. That’s what conditionals are for. Conditionals are not stability tests, but they do determine which stability tests are used.
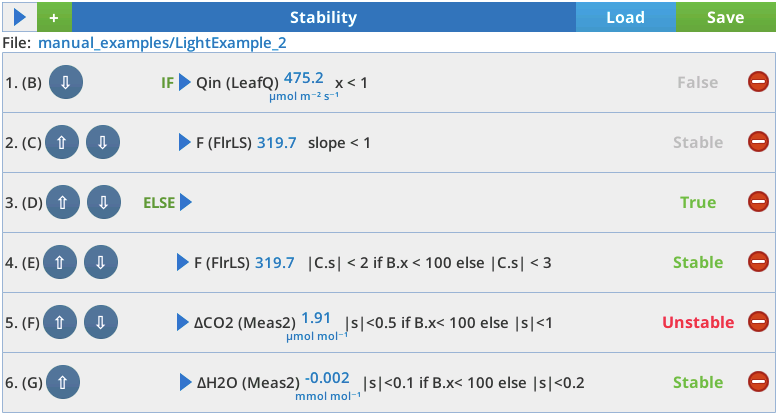
Consider the figure below: we’ve moved the fluorescence test to the top so it is always considered, then added an IF conditional that makes the remaining tests dependent on light level.
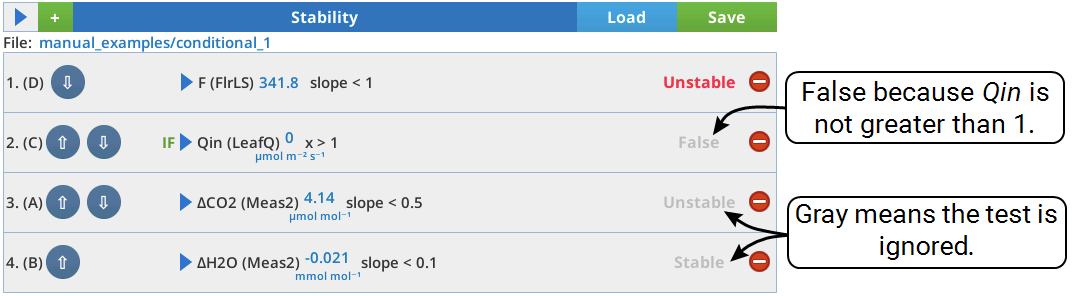
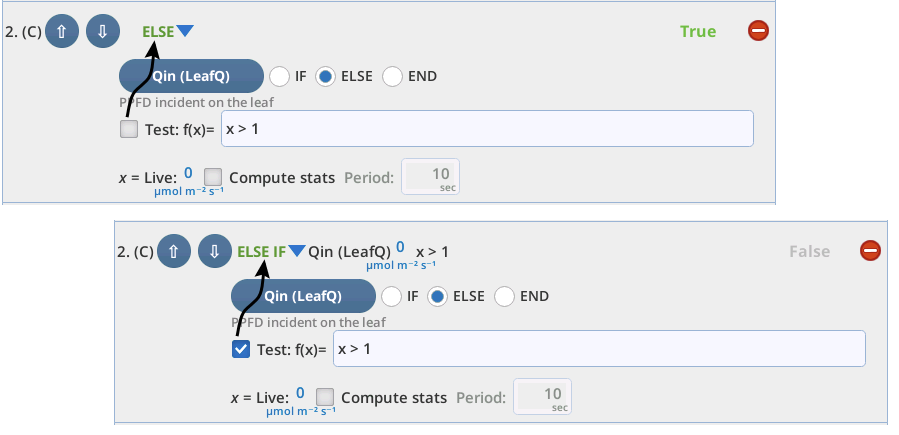
The item #2 IF is shown below in expanded form. The target variable is Qin from group LeafQ. We are interested in the current value, so do not need statistics. The test is for the current value of Qin (x) being greater than 1.
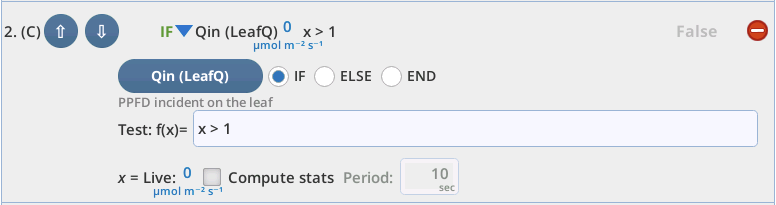
Note also that there are three types of conditionals: IF, ELSE, and END. An ELSE conditional has the same interface as an IF, but the Test is now optional (check box). With no test, ELSE functions as expected. With the test, ELSE functions as an ELSE IF.
The END conditional simply terminates a conditional structure, and is only needed if you have things appended that you want outside of the conditional structure. For example, we could re-arrange our dark adapted example to look like this:
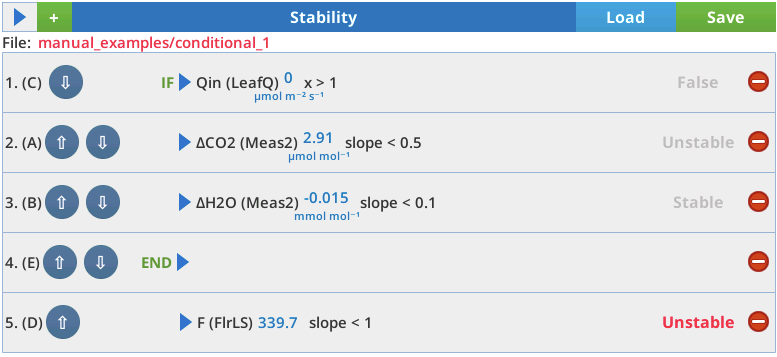
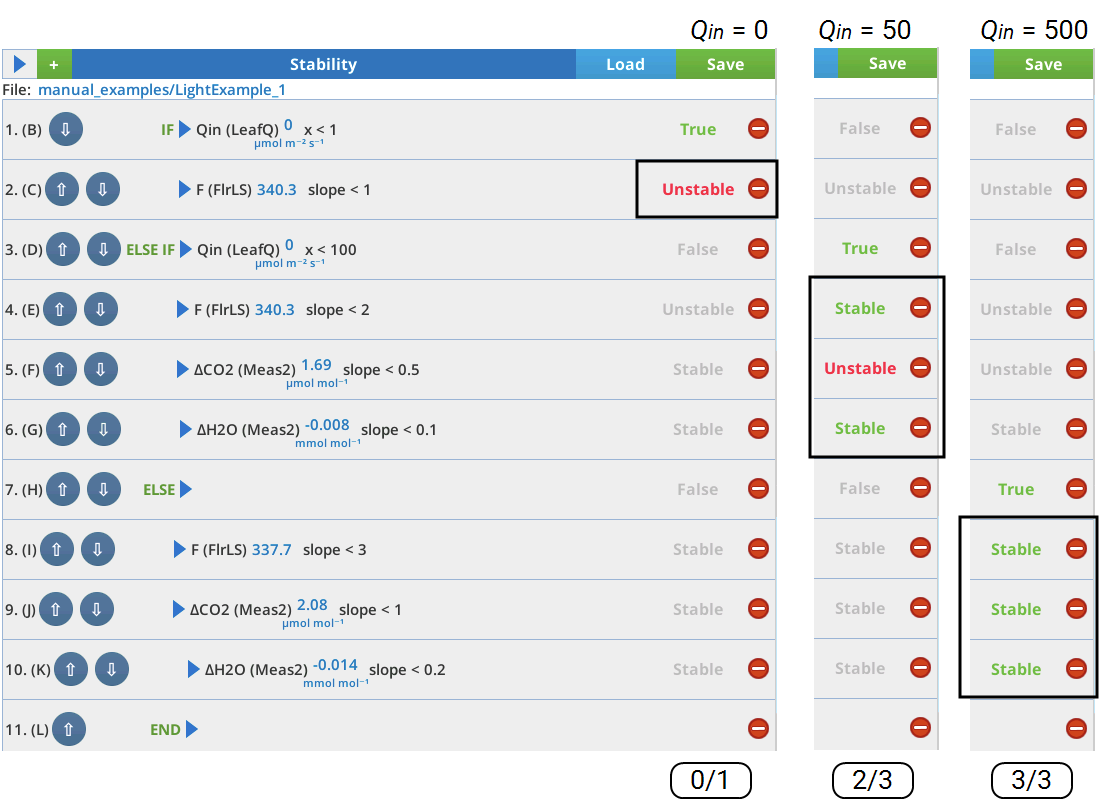
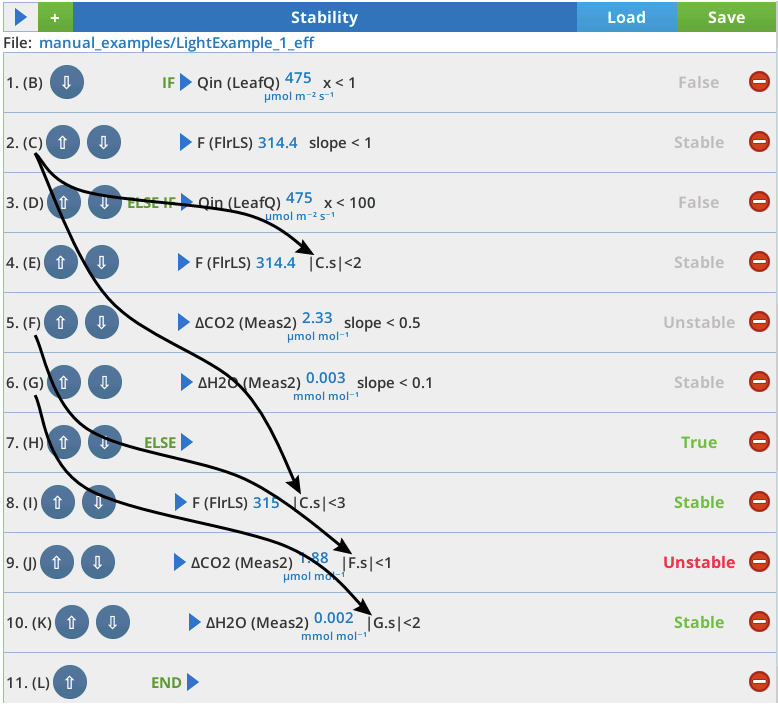
Figure 3‑28 illustrates a stability definition that has three different level of light, using an IF, ELSE IF, ELSE, and END.
Summary of rules
-
A conditional structure starts with an IF, can contain as many ELSE IFs as needed (but no more than one ELSE, which should come last) and optionally end with an END.
-
Conditional structures cannot be nested. Every IF is implicitly preceded by an END.
-
Improperly structured conditionals: In the event there is an ELSE or ELSE IF with no preceding IF, it is considered an IF that is True (in the case of ELSE), or is evaluated (in the case of ELSE IF). It marks the start of a new conditional structure.
-
Stability tests are always evaluated, even if they reside within a false part of a conditional structure.
-
Custom test results are treated as a Boolean (True or False), which means a non-zero numeric value would be considered as a True, and zero is False. Exception: a value of -1 signals that the test is inactive (not counted toward stability). We demonstrate a use for this feature below in Self-adjusting tests.
What if you want a conditional based multiple variables, such as light and CO2 concentration? The above rules preclude nesting conditionals - that is, you cannot put an IF…END inside another IF…END. There is another method of testing multiple variables, however, and that is to use an item’s variable name.
Each item in a stability definition displays its name in the summary line in parentheses, such as (C). Recall that in a custom test edit box (or in the test for an IF or ELSE IF), you can use variables x for the target’s current value, and - if doing statistics - s, d, and m for slope, standard deviation, and mean. You can also use any item’s variable name. For example, C.x is the real time value for item C.
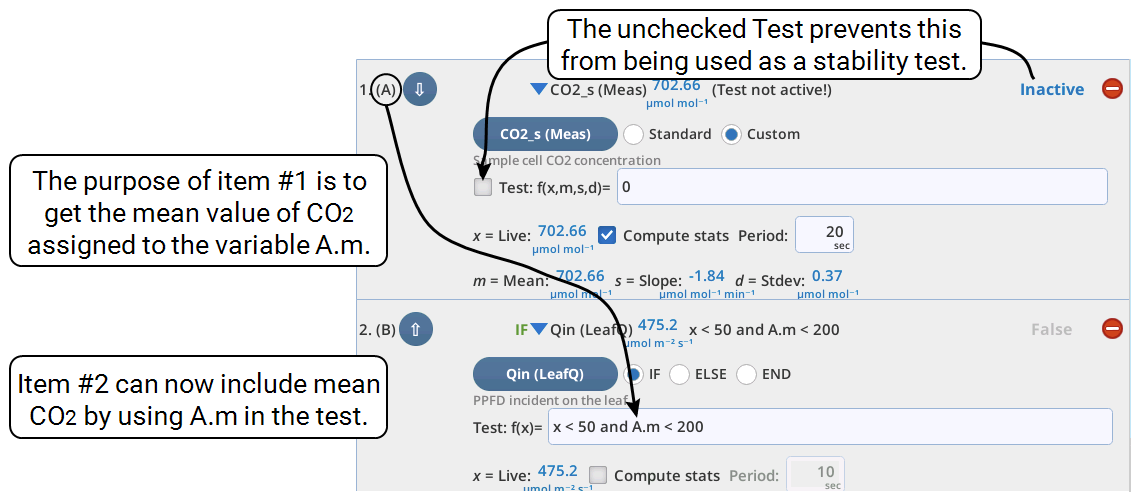
Figure 3‑29 shows an example for combing Qin and sample CO2 into one test. We create an inactive “dummy” test (item #1) that gives us access to the mean value of CO2 from anywhere else in the stability definition simply by referring A.m. A is the item’s variable name in this example, and m is the mean of the statistics that it is keeping.
Self-adjusting tests
It is also possible to make any single Custom stability test do different things under different conditions. For example, it can disable itself under some conditions, but be active under others, all in one test. Disabling is done by having the test return a -1, instead of True or False. The example below illustrates how to do this, using the Python if in its single line form
expression1ifconditionelse expression2
When condition is true, expression1 is returned; otherwise, expression2 is returned.
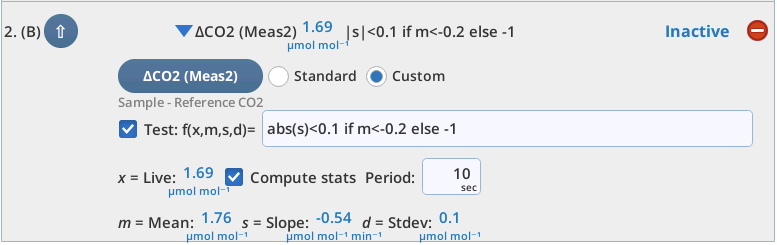
Note: Some target items will do this automatically: Tests whose target variable is fluorescence-related or TGA-related (trace gas analyzers) will automatically disable itself if the system is not configured for full fluorometry or for TGA support.
The single line IF can also be used for changing the test as conditions change. For example, we could accomplish the multi-light level stability test in Figure 3‑28 in fewer steps by making the non-dark items test according to whether Qin is above or below 100 μmol m-2 s-1 (Figure 3‑31).
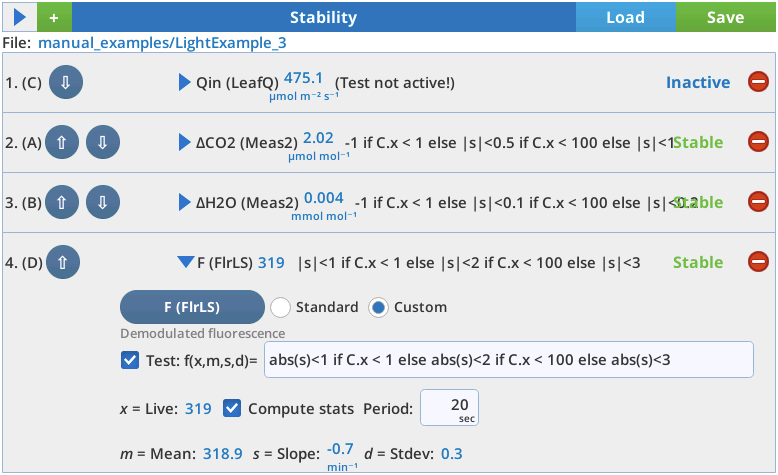
In fact, by nesting the in-line if:
exp1ifcond1elseexp2 ifcond2elseexp3
one could do the whole Figure 3‑28 example in four steps using no conditionals (Figure 3‑32). The obvious disadvantage of this approach, however, is that it can make stability definitions hard to read.
Improving efficiency
Consider the light curve example in Figure 3‑28. There are several tests that use the same target variable and time period for statistics, and only differ in slope threshold. This is an opportunity to use item variable names and improve system efficiency by only keeping a single set of statistics for each target variable.
Errors
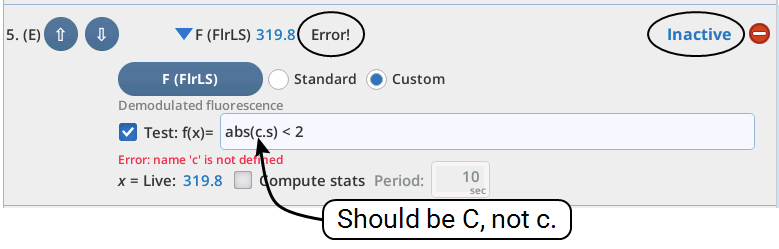
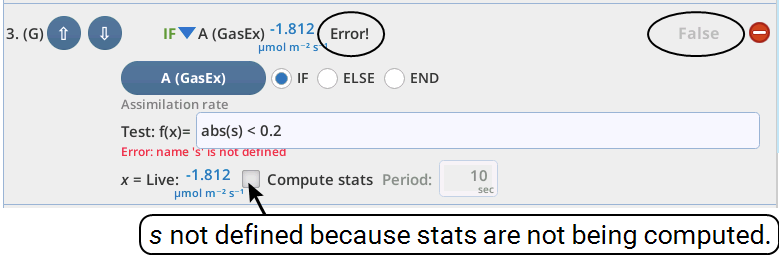
If there is a problem (typo, for example) with the Test string for a Custom test or conditional, you will be notified and the test disabled until you’ve corrected the problem.
Logging options
In its default configuration, the LI-6800 provides a continuous stream of measurements and calculations. You can monitor light levels and photosynthesis rates, for example, while changing those light levels. Over the course of 5 minutes, the instrument will have made hundreds of measurements. The question becomes, which of these will you want to retain for future use?
Log settings
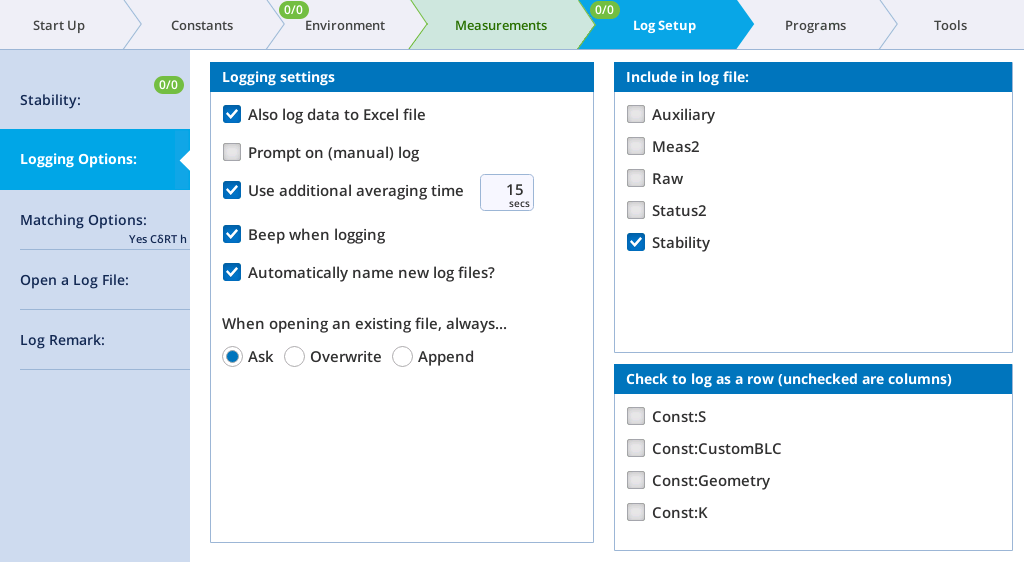
- Also Log Data to Excel file: Select this to log all your data values (those you selected, at least) and the equations that are used for computed values into a Microsoft® Excel® file. When you append an existing file (reopen and log more data to it), the instrument will create a new .xlsx file for the appended data.
- Prompt on (manual) log: Select this to open a prompt when logging. Prompts are user-settable questions and system constants that are configured under the Constants tab (see The Constants tab). For example, you may wish to open the prompt so you can enter the leaf area for each sample, or to record the species in your data file. When this option is enabled and a data point is logged, the data will be temporarily stored until you tap Continue or Cancel. If you tap Continue, the instrument writes the data to the log file. If you tap Cancel it discards the data. As soon as the prompt window shows up you can unclamp from the leaf. You can wait on the prompt screen however long is needed as the data is already temporary stored.
- Use Additional Averaging Time: The logged data reflects a potentially longer average time than the 4 second default that is used without extra averaging.
- Beep when logging: Turns the beep on or off.
- Automatically name new log files? Log files will be named with date and time stamp as the file name. Clear the check box to create new log files without the automatic name.
- When opening an existing file, always...
- Ask will give you the choice to overwrite or append the file.
- Overwrite will automatically delete all the data in that file and write new data to the file.
- Append will add the new data after any other data in the file.
Include in log file
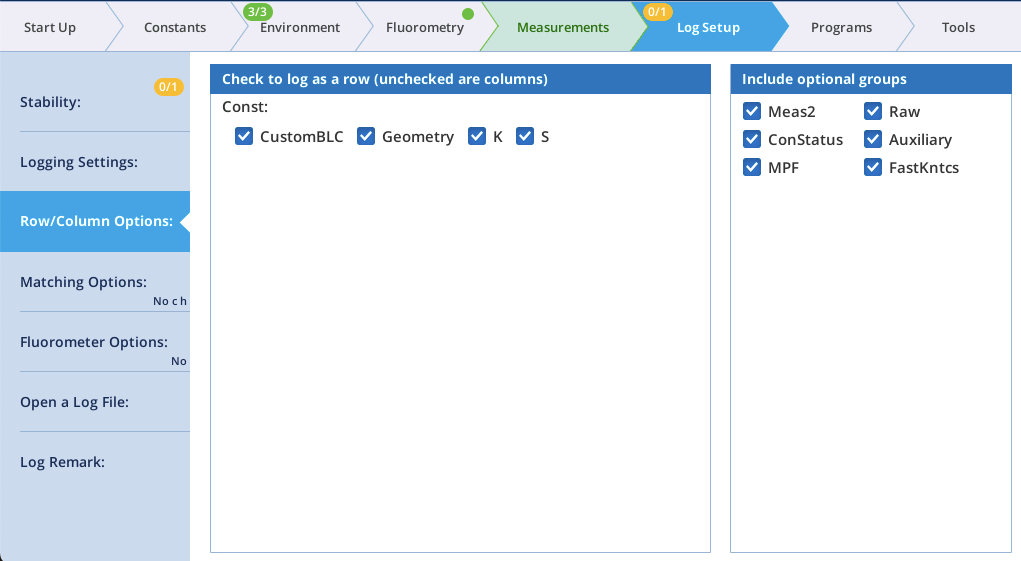
You have choices about the groups data to include. These include Meas2, Raw, Stability, FastKntcs, and MPF. We recommend logging all optional variables—data storage is cheap, but good data is expensive. See Summary of symbols for information about these groups.
Check to log as a row
Variables that are rarely changed do not need to be logged as columns, and can be logged as a row in the top of a file. Note that if a group is checked, every time a variable in that group is changed, a new row will be added in the data file indicating the updated variable.
Matching options
The match options available when logging allow independent control of CO2 and H2O matching (Figure 3‑34). These settings only pertain to whether or not a match is triggered and performed as part of a log event; they do not apply to matching initiated by tapping Auto or Manual in the match screen.
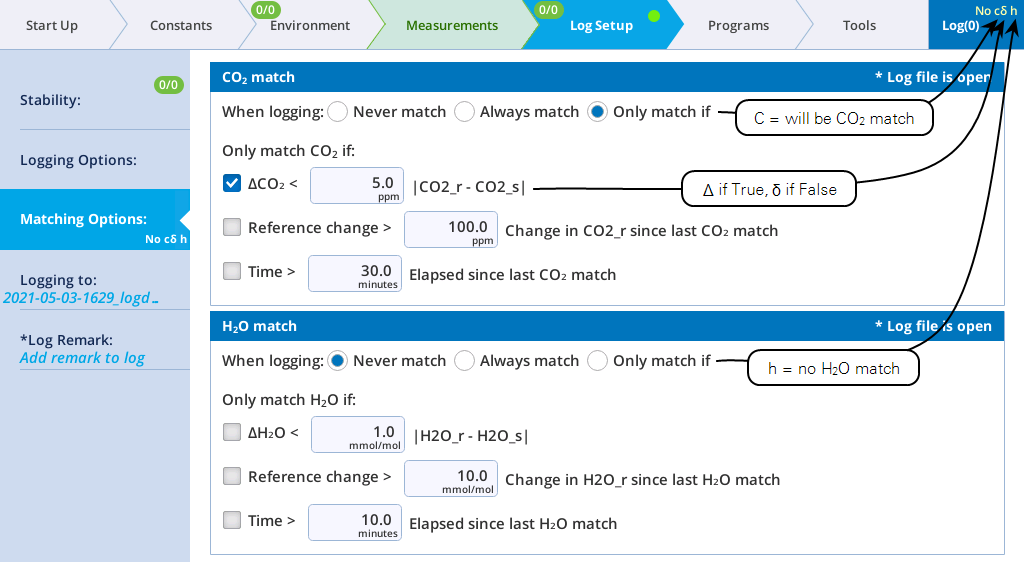
When a log file is open, the bottom line of the Log button indicates if a match will happen at the next log (Yes or No). C or c indicates if CO2 will be matched (C is yes, c is no), and H (yes) or h (no) indicates if an H2O match will occur. If conditional matching (Match only if) is enabled, there will be up to three code letters following the C/c and H/h, one for each item checked. Δ for ΔCO2 or ΔH2O if true (δ if false), R for reference if true (r if false), and T for time if true (t if false). Examples:
No c h - No match is happening, because both CO2 and H2O are set to Never match.
Yes C h - A CO2 match will occur, because it is set to Always match.
Yes CΔt hδ - CO2 is conditional on ΔCO2 (true) and time (false). H2O is conditional on ΔH2O (false).
Yes cδrt HδRt - Both CO2 and H2O are conditional based on all three options. There will be an H2O match, triggered by the reference change (R).
When a match is triggered because of only one gas (CO2 or H2O), only that gas will be matched.
The protocol for matching is described in Matching the IRGAs.
Fluorometer options
Under Log Files > Fluorometer Options, you specify what the fluorometer should do when a data point is logged (either by pressing the log button or automatically with a program or Background Program).
From the Flr Action at Log: menu, you can select from the following: 0: Nothing, 1: FoFm (dark) or FsFm' (light), and 2: FoFm (dark) or FsFm'Fo' (light). The second menu, Flash Type, presents four options: Auto: RF or MPF, Rectangular, MultiPhase, or Induction. Regarding the computation of Fo’, if you chose FsFm’ there will still be an Fo’ in the data and it will be computed using the last dark adapted measurement following the method of Baker and Oxborough, 1997 (2). If you choose FsFm’Fo’ then we use far-red light to measure Fo’.
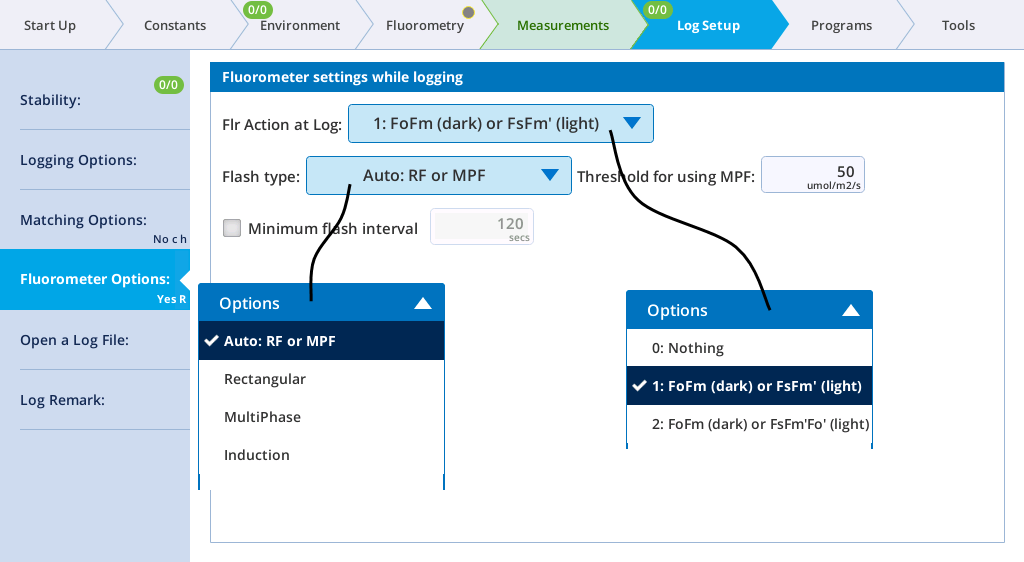
The Auto: RF or MPF option lets the system decide between a rectangular flash (RF) and a multiphase (MPF) for the logged flash event. The decision is based on the fluorometer's Q value (Q in group FlrLS) at the time of the log event. At low light levels, it is best to use the rectangular flash rather than the multiphase flash.
The option for Minimum flash interval allows frequent logging with occasional fluorescence events. The LI-6800 keeps track of the time since previous flash (TSPF), and if a log event happens with a TSPF less than the specified value, the Flr Action for that log event will in effect be 0: Nothing but just for that event. Thus, you can log every 10 seconds, for example, but only have fluorescence events every 2 minutes. This applies to manual and automatic logging. Also, the "previous flash" on which the timing is based is just that. It doesn't matter if that flash was triggered manually or automatically by a log event.
Open a log file
A log file is required to store measurements. You can either create a new file or append an existing file. You can also create a folder structure for your files and assign each log file a name. To create new file, tap Log Files > Open a Log File. Tap New File. Or, edit an existing file by selecting a file and then tapping Open.
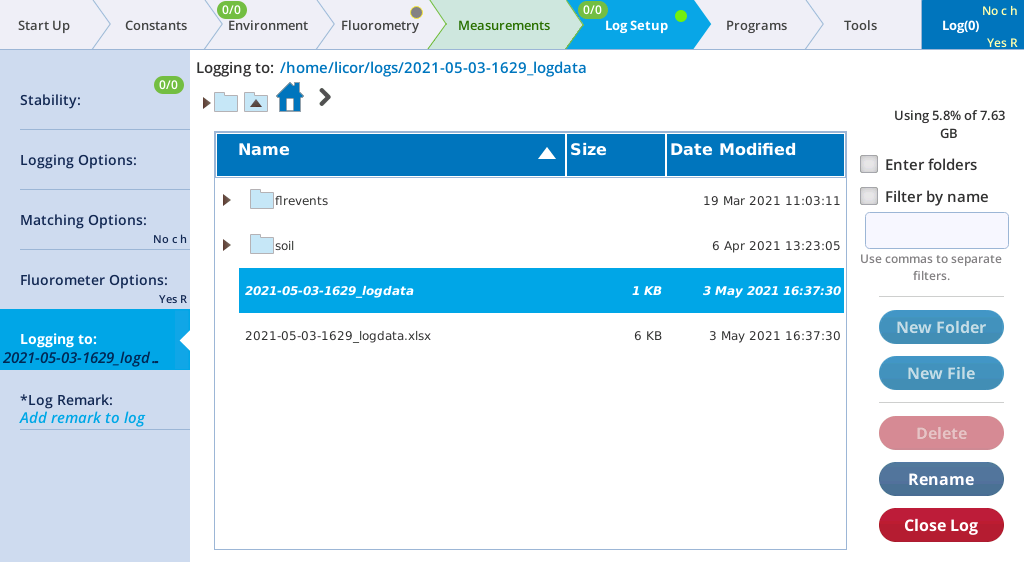
Once a log file is opened, the Log button at the top right of the display will be displayed.
Observations can be logged by pressing the Log (0) button on the screen or the log button on the sensor head. A short tap (<¼ second) is all that is required to log a measurement to the file. A successful log is indicated by the Log (#) incrementing with each new log (and a beep, if Beep when logging is enabled). Observations can be logged automatically with either an Auto Program or Program.
You will not be allowed to open a new log file if the file system is greater than 99.9% full (<4.67 MB available). The instrument will notify you of the issue.
When the measurement and log event are underway, the instrument will show **Log pending** in the upper right of the display.
Log remark
This option is active when a log file is open. Remarks are free form text rows saved in the data file to help you understand a particular measurement. For example, "Wow, this plant looks terrible," or "Apparently, deer do eat sotol." For plant # or treatment ID, consider adding a User Constant (see User). When you enter a remark, it will be saved in the log file with the time stamp.
- Where are the remarks logged?
- In text data files: Remarks are recorded in the text data file, either in the header information or inline with the other measurements. Remarks will always include the time stamp.
- In Excel files: Remarks are in a separate tab from the measurements, one called Remarks. Here again, remarks will always include the time stamp.