


In this chapter we describe how to transfer data from the analyzer.
Retrieving data from the instrument
The instrument records all of its data after it has warmed up. There is no way to turn data logging on or off because data are always logged. Typically, the instrument can store a total of 5,356,800 records, which is about 62 days of continuous data. Old records are overwritten when the memory is full. Therefore, we recommend that you routinely download important data from the instrument.
The instrument supports two protocols for transferring data:
- Direct download using TCP/IP (network protocols); see Direct download
- MQTT (Message Queuing Telemetry Transport); see Communication with the MQTT protocol
Direct download
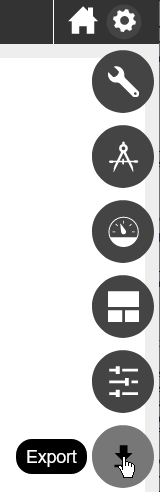
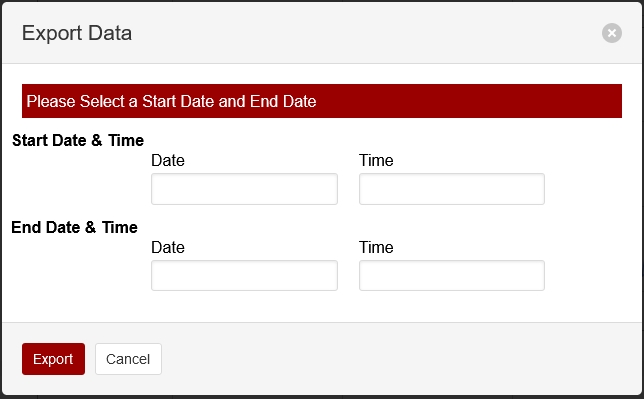
To retrieve data from the instrument, click Options > Export. Specify a date range and time period. Dates are displayed as YYYY-MM-DD. Time options are given in a 24-hour clock (00:00 through 24:00). Click Export. The web browser will prompt you to save or open the file, and then provide a text file with the requested data. The file has a .data extension. Measurements are recorded as tab-delimited text that can be opened in a text editor or spreadsheet application.
Components of the data file
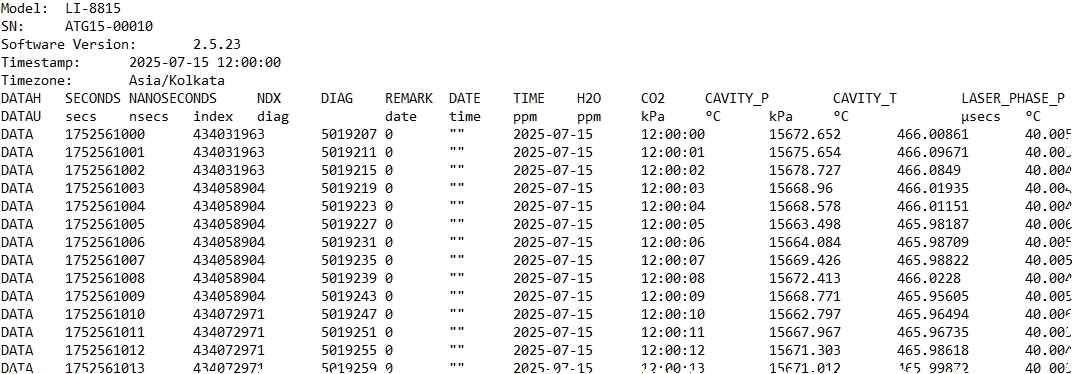
The text file will include a file header, data header, and data.
File header
The file header provides information about the instrument that measured the data.
Data header
The data header identifies the columns of values that are in the file. You'll see two rows: one called DATAH, which gives the variable names for the corresponding columns, and one called DATAU, which gives the units for the corresponding columns.
| DATAH | DATAU | Description |
|---|---|---|
| SECONDS | secs | Seconds past the universal epoch (Unix time). |
| NANOSECONDS | nsecs | Nanoseconds of the seconds |
| NDX | index | A count of scans. At four scans per second, the value increases by four counts per second. |
| DIAG | diag | Diagnostic code (see Status codes) |
| REMARK | - | The remark entered in the Remark field |
| DATE | date | Date of the record in yyyy-mm-dd |
| TIME | time | Time of the record in HH:MM:SS (according to the instrument clock) |
| H2O | ppm | Water vapor concentration |
| CO2 | ppm | Carbon dioxide mole fraction in dry air |
| CAVITY_P | kPa | Optical cavity pressure (typically near 39) |
| CAVITY_T | °C | Optical cavity temperature (typically near 55) |
| LASER_PHASE_P | kPa | Laser phase pressure |
| LASER_T | °C | Laser temperature |
| RESIDUAL | n/a | Difference between raw and best fit spectra |
| RING_DOWN_TIME | µsecs | Indicator of cavity resonance |
| THERMAL_ENCLOSURE_T | °C | Optical enclosure temperature |
| PHASE_ERROR | counts | Dimensionless indicator of mode lock state |
| LASER_T_SHIFT | °C | Shift in laser center wavelength from factory calibration |
| INPUT_VOLTAGE | V | Power supply voltage |
| CHK | CHK | Checksum; to ensure that the receiving software received the data without error, and to reject corrupted data lines |
Time, data , and diagnostics
The time, data, and diagnostics are given under the header.
The relationship between Unix Epoch time and the time stamp
The instrument measures time based upon the number of seconds past the Unix epoch (GMT: Thursday, January 1, 1970 12:00:00 AM). This value is represented in the Seconds column of the data set. You can easily convert the Unix epoch to date and time using online resources (e.g., https://www.epochconverter.com). If you have selected a time zone, the Date and Time columns will represent the Unix epoch time adjusted by an offset for the time zone.